Led the product design for the security platform, improving appearance, usability and expanding capabilities.
Introduced new features and optimized existing ones to create a more intuitive and efficient system.
The platform's design emphasizes ease of use, allowing security personnel to monitor and manage diverse systems seamlessly.
Users benefit from real-time data visualization, enabling prompt responses to incidents and potential threats.
The system offers customizable dashboards and reporting tools, allowing organizations to tailor the platform to their specific needs and preferences.
Security operations centers typically manage dozens of disparate systems - surveillance cameras, access control, alarm panels, building management, IoT sensors, and communication networks - each generating its own stream of data and alerts.
Operators are forced to monitor multiple interfaces simultaneously, manually correlating events across different platforms to understand what's happening. This fragmented approach means critical connections between seemingly unrelated events are missed, response times are delayed, and security teams struggle to maintain comprehensive situational awareness across their entire infrastructure.
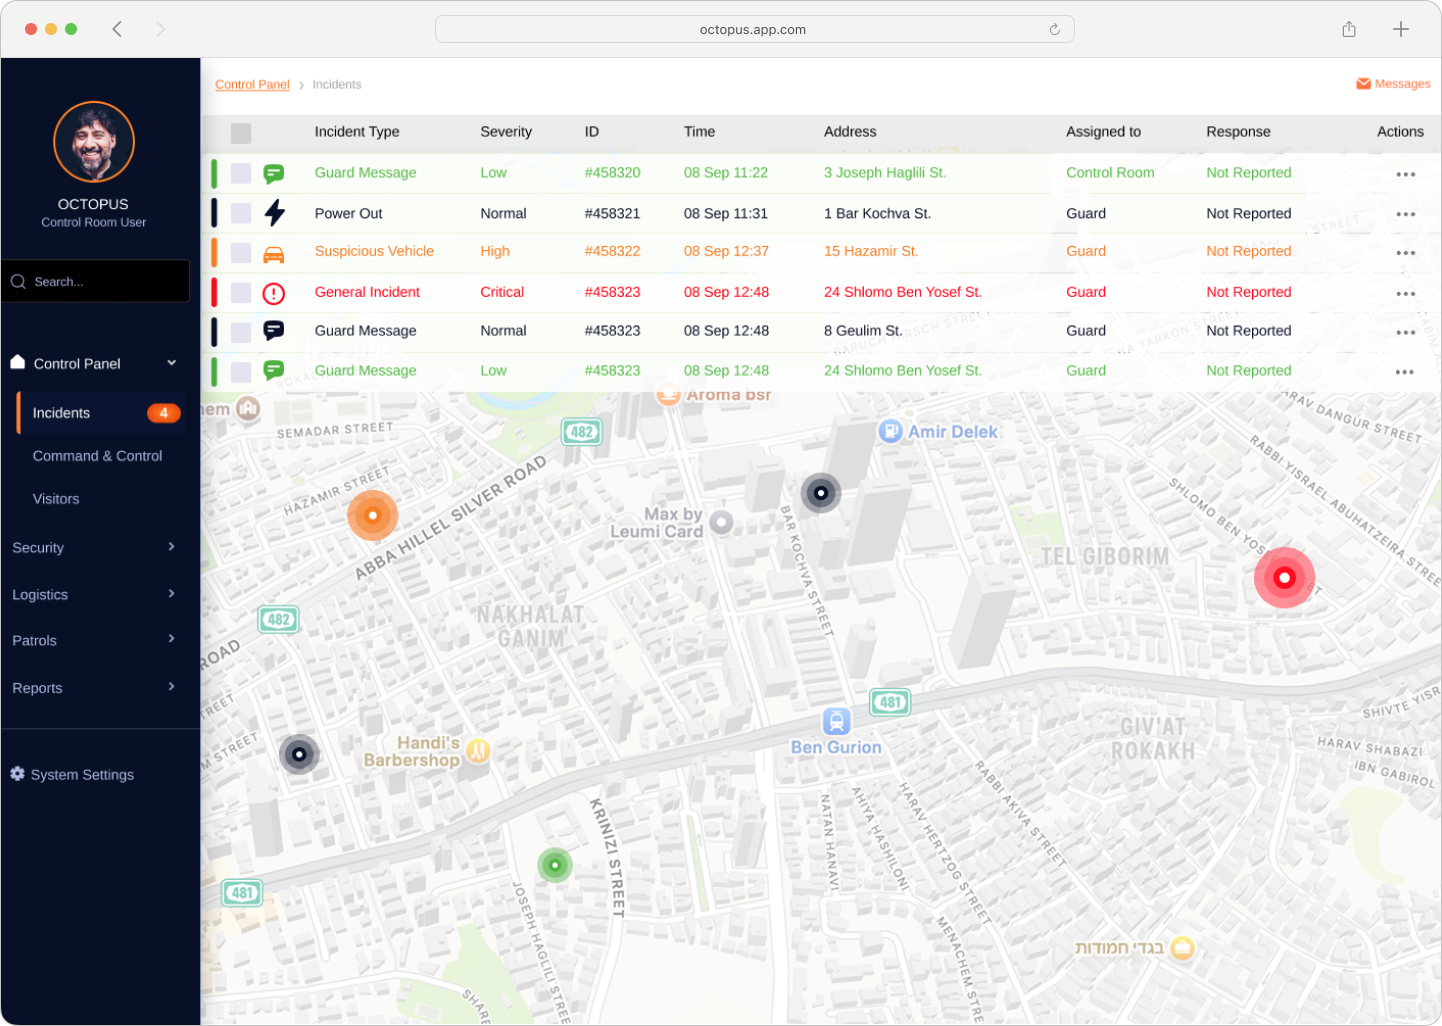
The Main Incidents Page consolidates all security events into a unified command center, eliminating the need to switch between multiple interfaces. The design divides the screen into two key components: a real-time incident feed at the top that automatically updates as events occur, and an interactive map below that visualizes incidents by location and severity.
This unified view enables operators to quickly identify patterns, prioritize responses, and maintain comprehensive situational awareness. Incidents can be filtered and sorted by severity, type, time, location, and other criteria, allowing security teams to focus on what matters most while maintaining visibility across the entire infrastructure.
The original Visitors interface provided only a real-time snapshot of who was currently onsite, offering no historical context or analytical insights. Security managers and operations teams lacked visibility into visitor patterns, trends, and operational metrics that are essential for strategic decision-making.
Without access to historical data, users couldn't analyze daily or monthly visitor volumes, identify peak times, understand visitor type distributions, or track delays and bottlenecks. To generate any meaningful reports, staff were forced to export raw log data and manually compile statistics in external spreadsheets - a time-consuming process that prevented real-time decision-making and strategic planning.
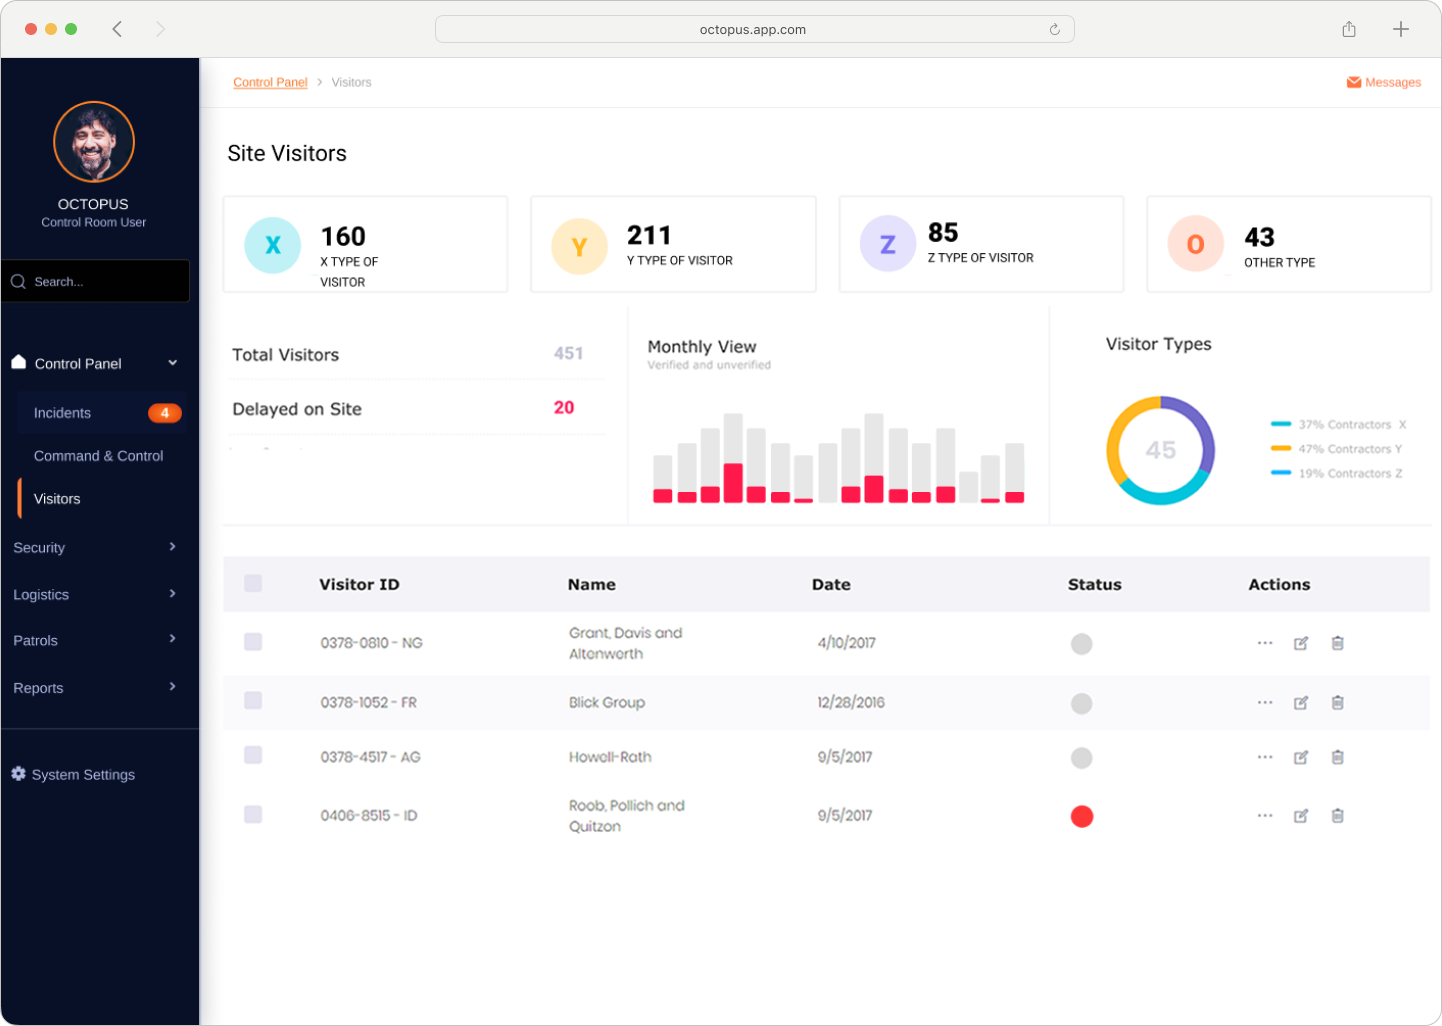
The design process began with comprehensive interviews with control room staff and security managers to understand their specific reporting needs and pain points. Based on these insights, the new Visitors dashboard was structured around three key visualization components.
The enhanced Visitors dashboard transformed how security teams interact with visitor data. By consolidating statistics cards, monthly trend visualizations, and visitor type distributions into a single interface, operators can now identify anomalies - such as sudden spikes in visitor volume or recurring delays - directly on the screen without exporting data or performing manual analysis.
The implementation significantly reduced the time required for report preparation, eliminating hours of manual data compilation. Security operations centers reported faster incident resolution and improved situational awareness, with teams able to make data-driven decisions in real-time rather than relying on outdated manual reports.